Back-of-the-Envelope Estimation
Learn simple sizing math for traffic, storage, bandwidth, cache, and worker capacity before choosing architecture.
What you will be able to do
Back-of-the-envelope estimation is quick engineering math. It helps you decide whether a simple design is enough or whether scale changes the architecture.
Why Estimation Matters
Without estimates, system design becomes guesswork. With estimates, you can explain why a single database might be enough, why a cache is useful, why a queue is required, or why a service must scale horizontally.
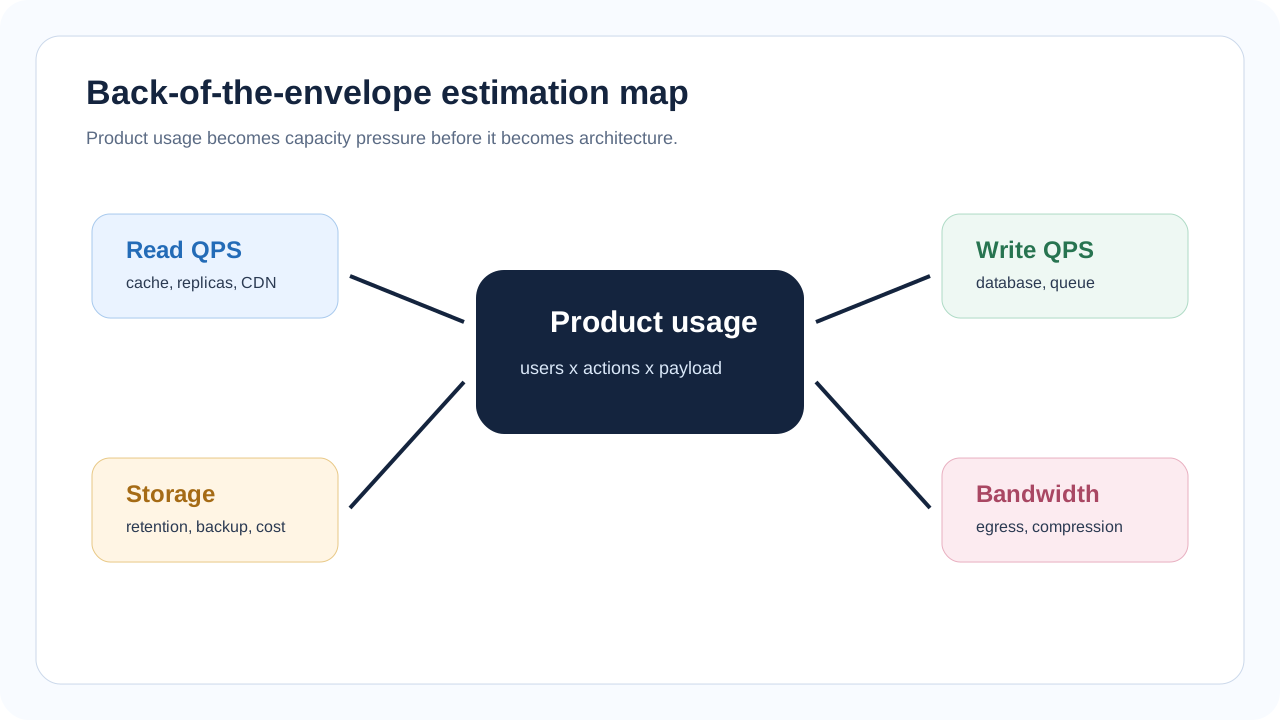
| Estimate | Question | Architecture impact |
|---|---|---|
| Write traffic | How many new records or updates per second? | Database writes, queue throughput, worker count. |
| Read traffic | How often is data fetched? | Indexes, cache, replicas, CDN. |
| Storage | How much data accumulates over time? | Database size, object storage, retention, backup cost. |
| Bandwidth | How much data moves across the network? | CDN, compression, egress cost. |
| Peak factor | How much higher is peak than average? | Autoscaling, buffers, rate limiting, backpressure. |
Core Conversions
You do not need complex math. You need a few conversions and the discipline to state assumptions clearly.
| Conversion | Approximation |
|---|---|
| 1 day | 86,400 seconds, often rounded to 100,000 seconds |
| 1 million/day | About 10 requests/sec on average |
| 10 million/day | About 100 requests/sec on average |
| 100 million/day | About 1,000 requests/sec on average |
| 1 KB x 1 million | About 1 GB |
| 1 MB x 1 million | About 1 TB |
Design principle
Estimation is not about perfect numbers. It is about discovering whether the design pressure is small, medium, large, or dangerous.
Scenario: URL Shortener
Suppose we design a URL shortener. Users create short links, share them, and other users click those links. Reads are usually much higher than writes.
| Assumption | Value | Why it matters |
|---|---|---|
| New short links | 10 million/day | Write volume. |
| Redirect clicks | 1 billion/day | Read volume. |
| Average URL record | 500 bytes | Storage estimate. |
| Retention | 5 years | Long-term storage. |
| Peak factor | 5x average | Capacity planning. |
Step-by-Step Estimate
Use rounded numbers first. You can refine later when the design needs precision.
| Step | Calculation | Result |
|---|---|---|
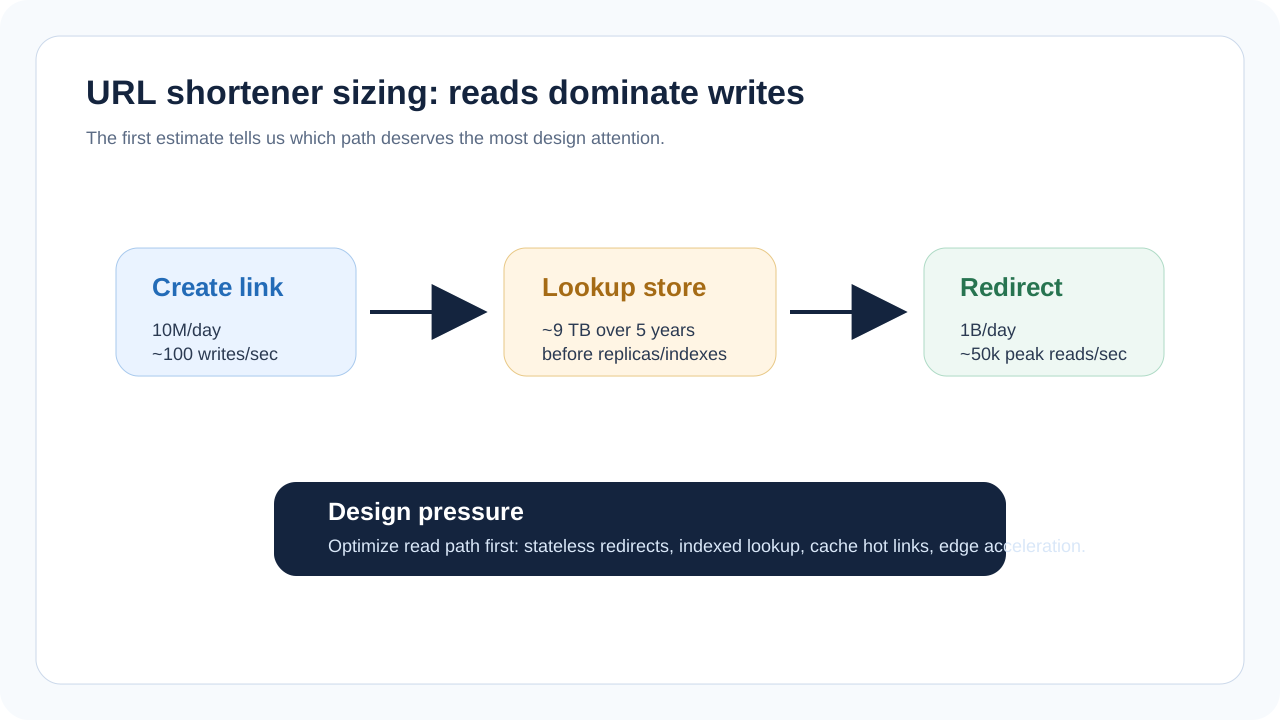
| Write QPS | 10 million links/day / 100,000 sec | About 100 writes/sec |
| Read QPS | 1 billion clicks/day / 100,000 sec | About 10,000 reads/sec |
| Peak read QPS | 10,000 avg x 5 | About 50,000 reads/sec |
| Daily storage | 10 million x 500 bytes | About 5 GB/day |
| 5-year storage | 5 GB/day x 365 x 5 | About 9 TB before replicas/indexes |
What the Estimate Tells Us
The write path is moderate, but the read path is large. That suggests careful indexing, cache for hot short codes, CDN or edge caching where possible, and horizontal scaling for redirect services. It does not immediately require every advanced distributed system pattern.
| Observation | Design response |
|---|---|
| Reads dominate writes | Optimize redirect lookup path first. |
| Peak reads are high | Use stateless redirect service behind load balancing. |
| Hot links may get huge traffic | Cache popular short code mappings. |
| Storage grows steadily | Plan partitioning, retention, backup, and index size. |
| Redirect must be fast | Keep synchronous path small and avoid unnecessary joins. |
Cloud Capacity Thinking
Cloud platforms do not remove estimation. They make capacity easier to adjust, but you still need to understand quotas, cost, region limits, autoscaling behavior, and managed service constraints.
| Need | AWS examples | GCP examples | Azure examples |
|---|---|---|---|
| Stateless redirect compute | ECS/EKS/Lambda | Cloud Run/GKE | Container Apps/AKS/Functions |
| Lookup storage | DynamoDB/RDS/Aurora | Spanner/Cloud SQL/Firestore | Cosmos DB/Azure SQL |
| Hot lookup cache | ElastiCache | Memorystore | Azure Cache for Redis |
| Edge acceleration | CloudFront | Cloud CDN | Azure Front Door/CDN |
| Metrics and autoscaling signals | CloudWatch | Cloud Monitoring | Azure Monitor |
Common Estimation Patterns
| Product | Likely dominant estimate | Why |
|---|---|---|
| Chat | Writes and fanout | Messages must reach recipients quickly. |
| News feed | Reads and ranking work | Many users read more than they post. |
| Video streaming | Bandwidth and storage | Large media files dominate cost. |
| Analytics | Write ingestion and batch processing | Events arrive continuously and are processed later. |
| Rate limiter | Small fast reads/writes | Every protected request touches limiter state. |
Beginner Mistakes
- Using exact-looking numbers without stating assumptions.
- Estimating users but not operations per user.
- Ignoring peak traffic and only designing for average traffic.
- Estimating request count but not payload size or storage growth.
- Jumping to sharding before seeing whether the estimated scale actually requires it.
Guided Practice
Practice task
Estimate a simple photo sharing app: 1 million daily active users, 10% upload one photo/day, each photo averages 2 MB, each user views 50 photos/day. Estimate uploads/sec, views/sec, daily storage, and what design pressure dominates.
Sample Answer
| Estimate | Calculation | Result |
|---|---|---|
| Uploads/day | 1M users x 10% | 100k photos/day |
| Upload QPS | 100k / 100k seconds | About 1 upload/sec average |
| Views/day | 1M users x 50 | 50M views/day |
| View QPS | 50M / 100k seconds | About 500 views/sec average |
| Daily storage | 100k photos x 2 MB | About 200 GB/day before replicas and thumbnails |
| Dominant pressure | Large media reads and storage | Use object storage, CDN, thumbnails, and lifecycle policies. |
Module 1 Wrap-Up
You now have the foundation for system design thinking: define the product behavior, clarify requirements, quantify non-functional requirements, and estimate scale before choosing architecture.
Before You Continue
- You should be able to estimate average QPS from daily traffic.
- You should be able to estimate storage growth from item size and retention.
- You should understand why peak traffic matters.
- You should be able to explain what design pressure dominates a product.
- You are ready for Module 2, where requirements turn into APIs, services, and request flows.